About
Our goal was to make it easier to explore the FAA's Wildlife Stike Database. This data has an incredible amount of information, but the size makes it difficult to explore in an efficient manner.
The Data
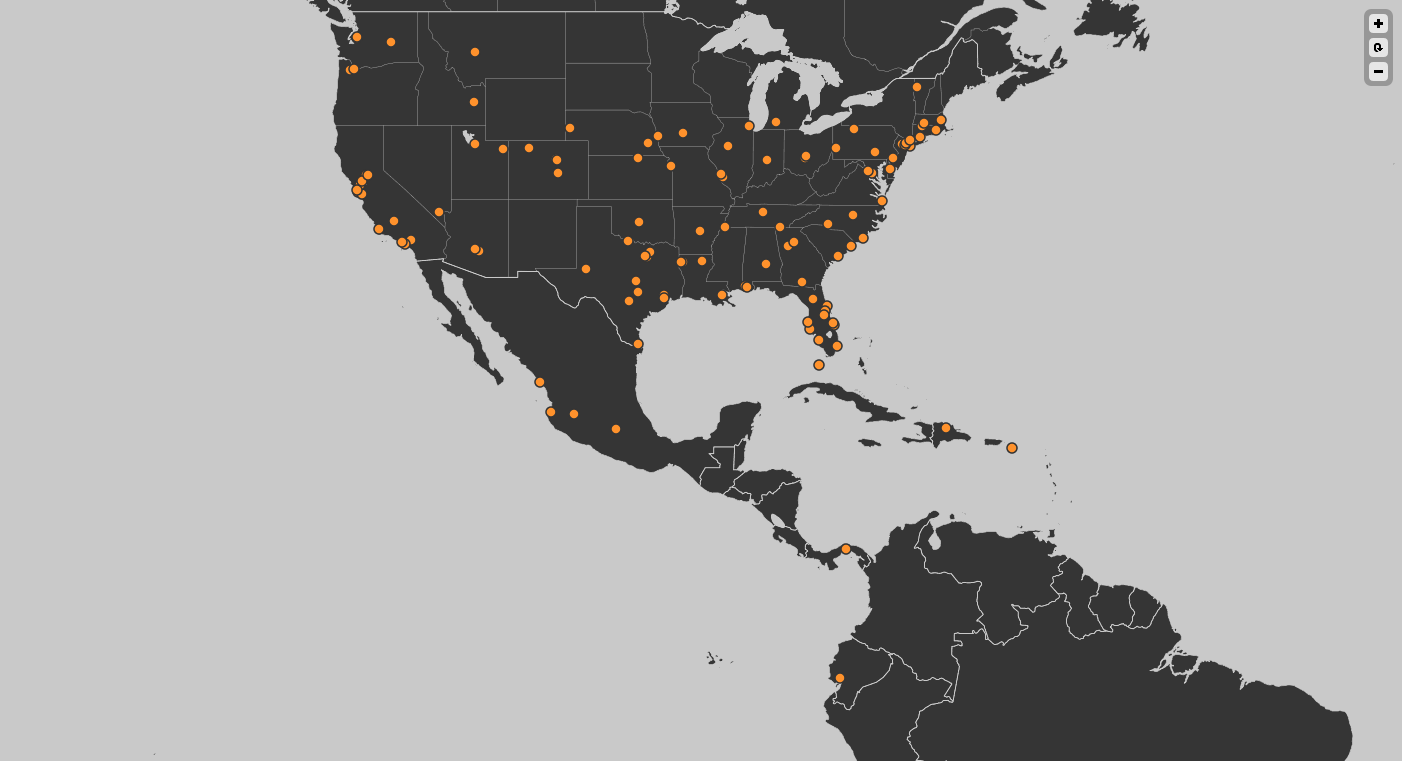
The main data for this project comes from the FAA's Wildlife Stike Database. We used a subset of the data from 1999 through July of 2012. This gave us 110,942 incidents. When the visualization loads, the first date that appears is January of 2009. We chose this period because this was when Flight 1549 hit a flock of birds while taking off from LaGuardia airport in New York City and made an emergency landing in the Hudson River.
Tools
Once we had the data we used the Google Places API to find latitude and longitude for all of the airports where strikes occured. D3 is a javascript visualization library that we used to plot the airports on a map originally designed by Stamen Design.
Team
Wesley Lauka, Jeremy Salfen, Phillip Tularak, Nikki Roda, and Paul Ellebrecht created this visualization as a final project for Information Visualization at the University of Michigan - School of Information in the Fall of 2012.
This site is optimized for Google Chrome